From the very beginning, the idea of a database of the oldest manuscripts of the Etymologiae included visual tools that could communicate information about these manuscripts alongside the text-based records. Since it became quickly clear that many of the early medieval codices of the Etymologiae could be localized precisely, the priority was given to a map, which is currently the only visual tool implemented in the beta version.
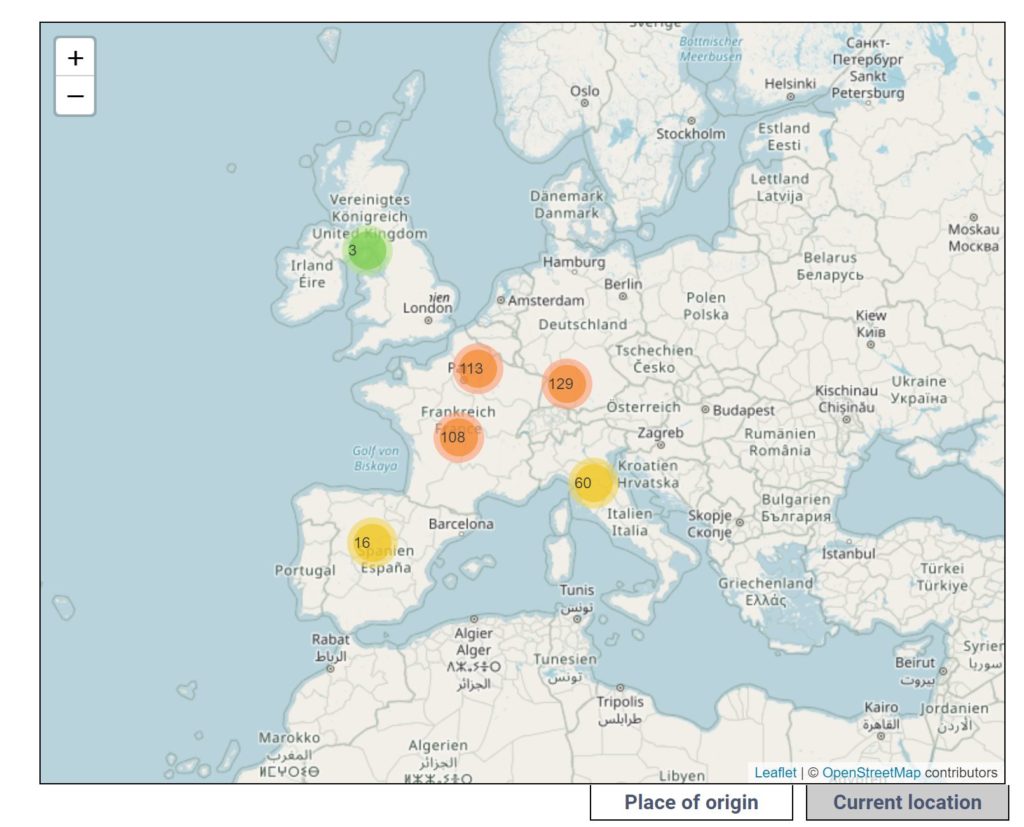
The map has two different viewing modes, which you can switch between using the two tabs below it. The place of origin mode allows you to view manuscripts with a known place of origin according to their medieval place of origin. The current location mode allows you to view all manuscripts based on their current location of preservation. Both viewing modes are sensitive to queries and you will therefore see different number of manuscripts based on the facets you selected.
Important: we don’t know the precise place of origin of many manuscripts. Many cannot be localized more precisely than to regions such as ‘northern France’ or ‘southern Italy’ or to smaller areas such as ‘Brittany’ or ‘Loire valley’. These appear on the map, too. A single representative point was selected for display and assigned to all manuscript with the same region or area of origin. For this reason, the map should be understood as an illustrative tool, not as an exact instrument.